10.9 Quick Analysis Example for qPCR Results
qPCR is a common assay in experimental design. Here we provide a walkthrough example to quickly help researchers construct analysis results for their qPCR data.
Example data download: Github link
10.9.1 Importing qPCR Data
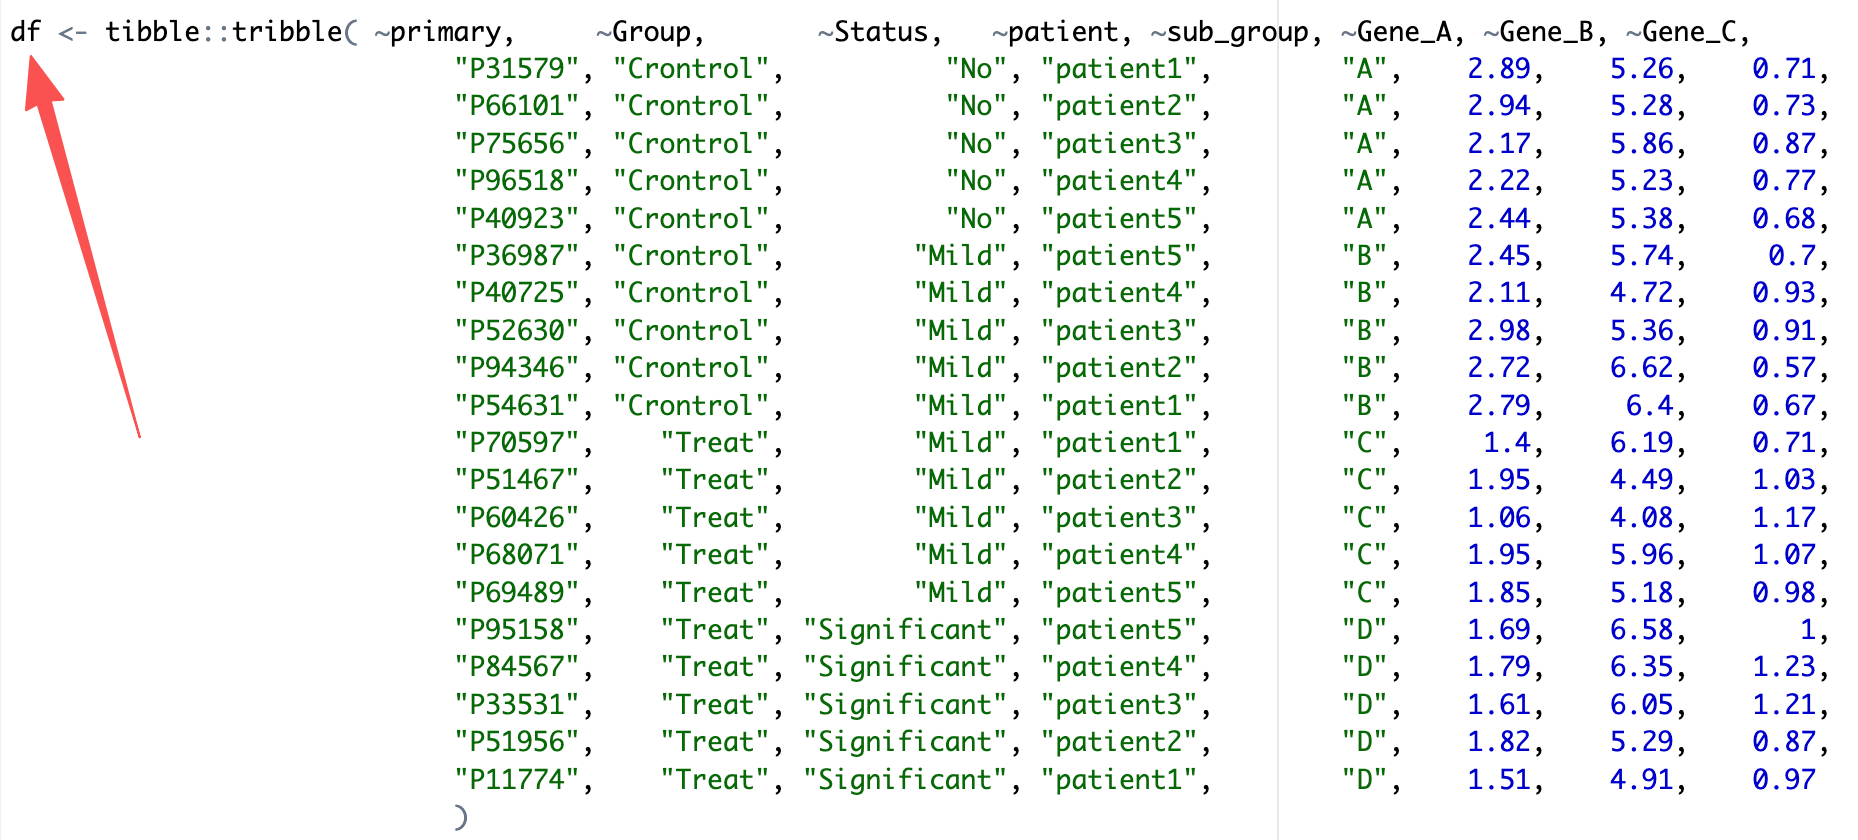
Step1:Copy the required data from an Excel file and execute the following in R. Gene_A, Gene_B, and Gene_C represent qPCR expression values, while the other columns contain grouping information.

if (!requireNamespace("datapasta", quietly = TRUE))  install.packages("datapasta")
datapasta::tribble_paste()
Step2:In the RStudio interface, the copied data is automatically formatted into a table. Using the tribble_paste function from the datapasta package assigns this data frame directly to the variable df and stores it.
Step3:Use EasyMultiProfiler to conveniently import df into an MAE (MultiAssayExperiment) object.
library(EasyMultiProfiler)

coldata <- df |> dplyr::select(-Gene_A,-Gene_B,-Gene_C) |>
  tibble::column_to_rownames('primary') |>
  dplyr::mutate(Status = factor(Status,levels = c('No','Mild','Significant')))

assay_data <- df |>dplyr::select(-Group,-Status,-patient,-sub_group) |>
  tibble::column_to_rownames('primary') |> t() |> as.data.frame() |>
  tibble::rownames_to_column('feature')

MAE <- EMP_easy_import(data = assay_data,coldata = coldata,type = 'normal')
10.9.2 qPCR Data Analysis and Visualization
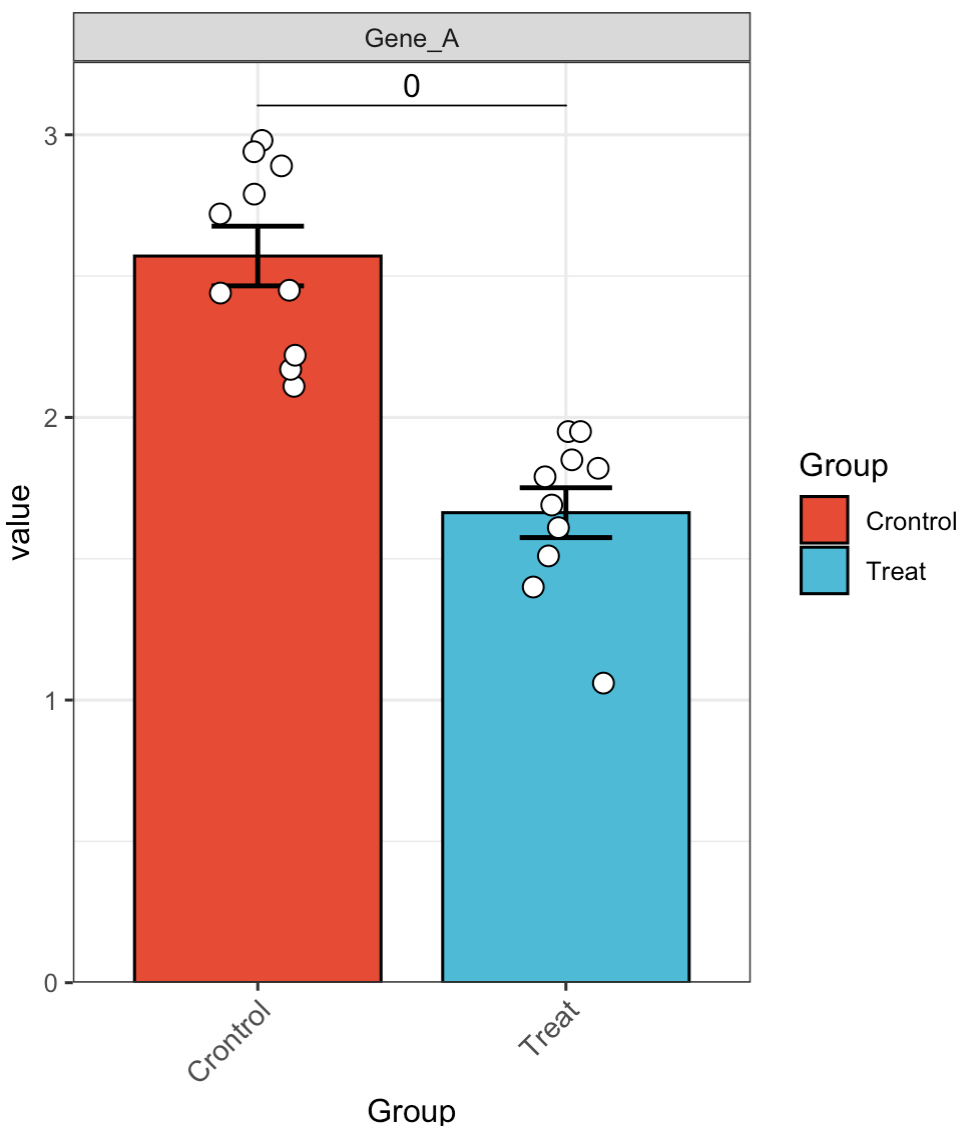
🏷️Example 1: Quickly analyze the expression of a single gene.
MAE |>
  EMP_assay_extract() |>
  EMP_filter(filterFeature = 'Gene_A') |>
  EMP_barplot(estimate_group = 'Group',method = 't.test')
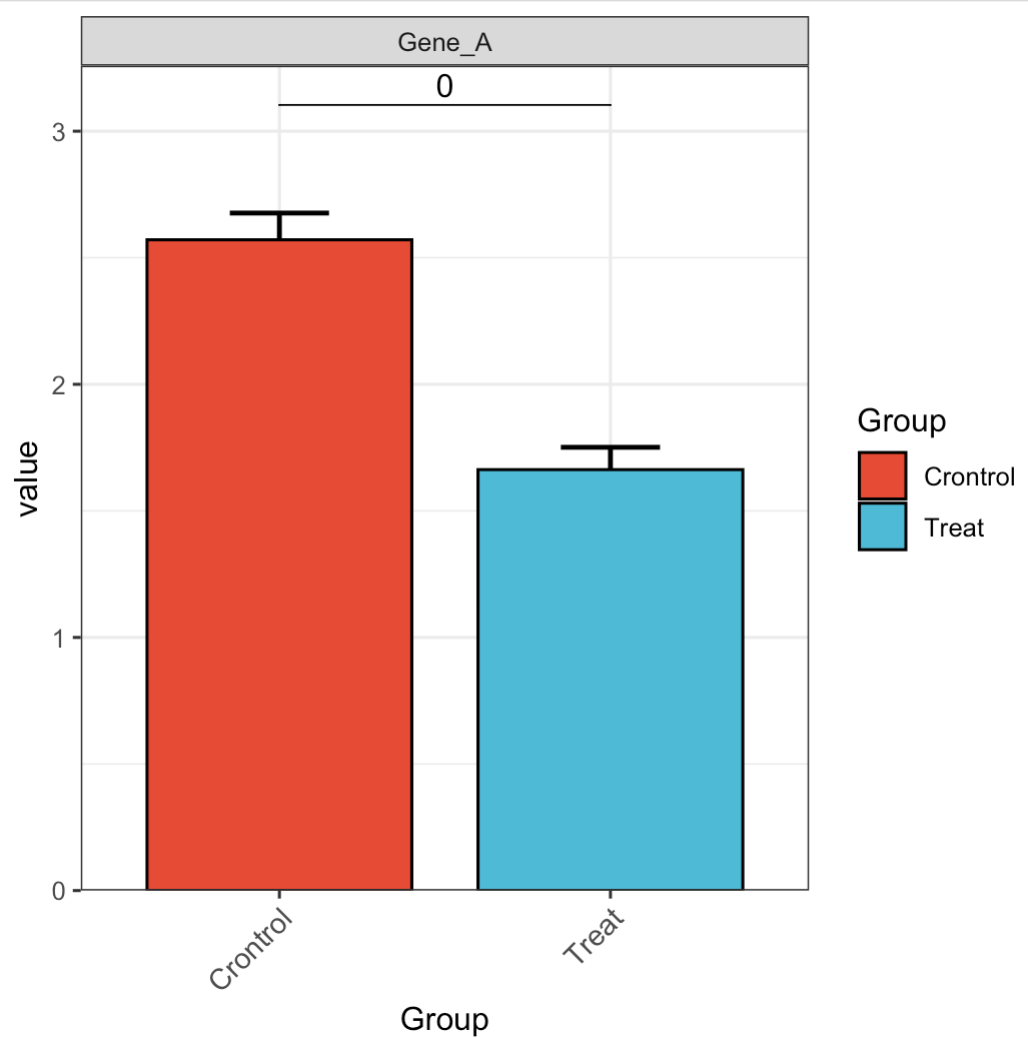
🏷️Example 2: Hide individual data points.
MAE |>
  EMP_assay_extract() |>
  EMP_filter(filterFeature = 'Gene_A') |>
  EMP_barplot(estimate_group = 'Group',
              hide_point = TRUE,
              method = 't.test')

🏷️Example 3: Adjust error bars.
MAE |>
  EMP_assay_extract() |>
  EMP_filter(filterFeature = 'Gene_A') |>
  EMP_barplot(estimate_group = 'Group',
              hide_point = TRUE,
              error_bar = 'upper',
              method = 't.test')
🏷️Example 4: Paired test.
MAE |>
  EMP_assay_extract() |>
  EMP_filter(filterFeature = 'Gene_A') |>
  EMP_barplot(estimate_group = 'sub_group',
              method = 't.test',
              paired_group = 'patient')
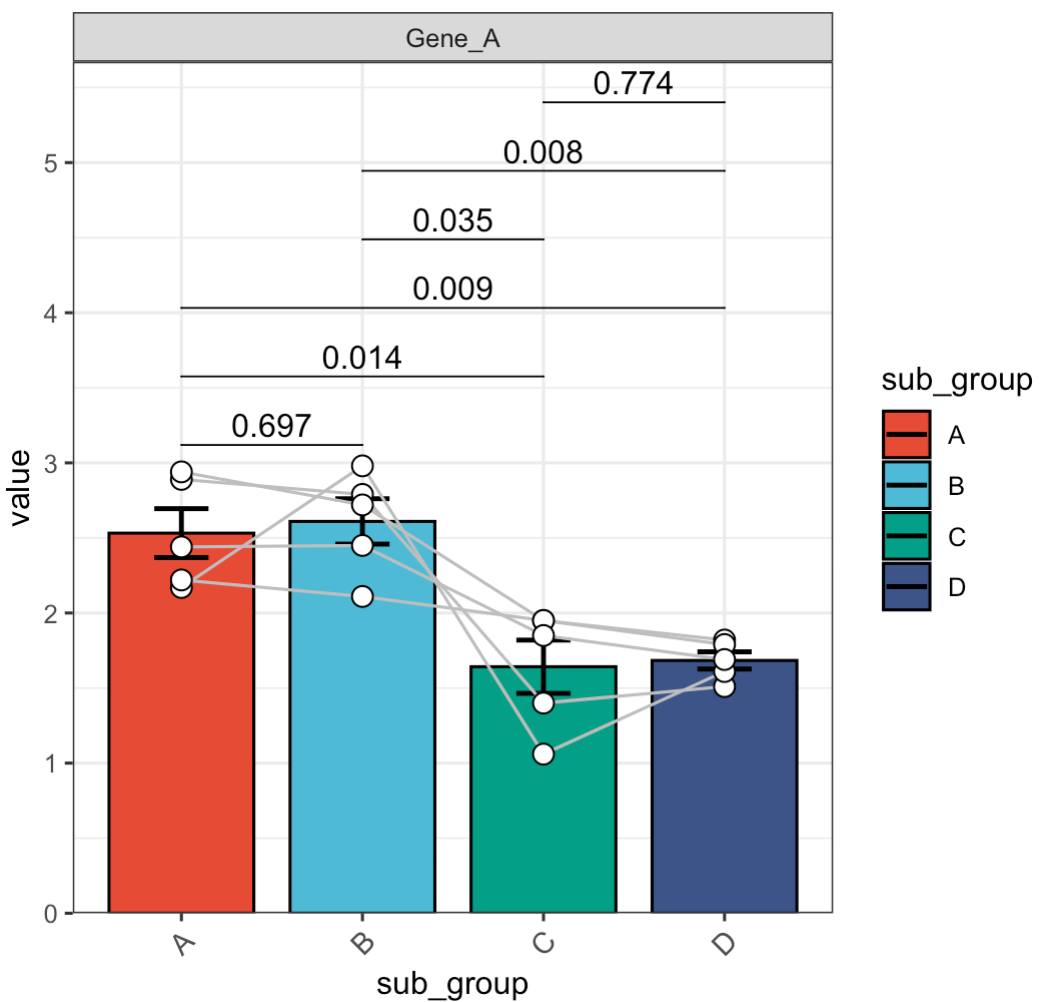
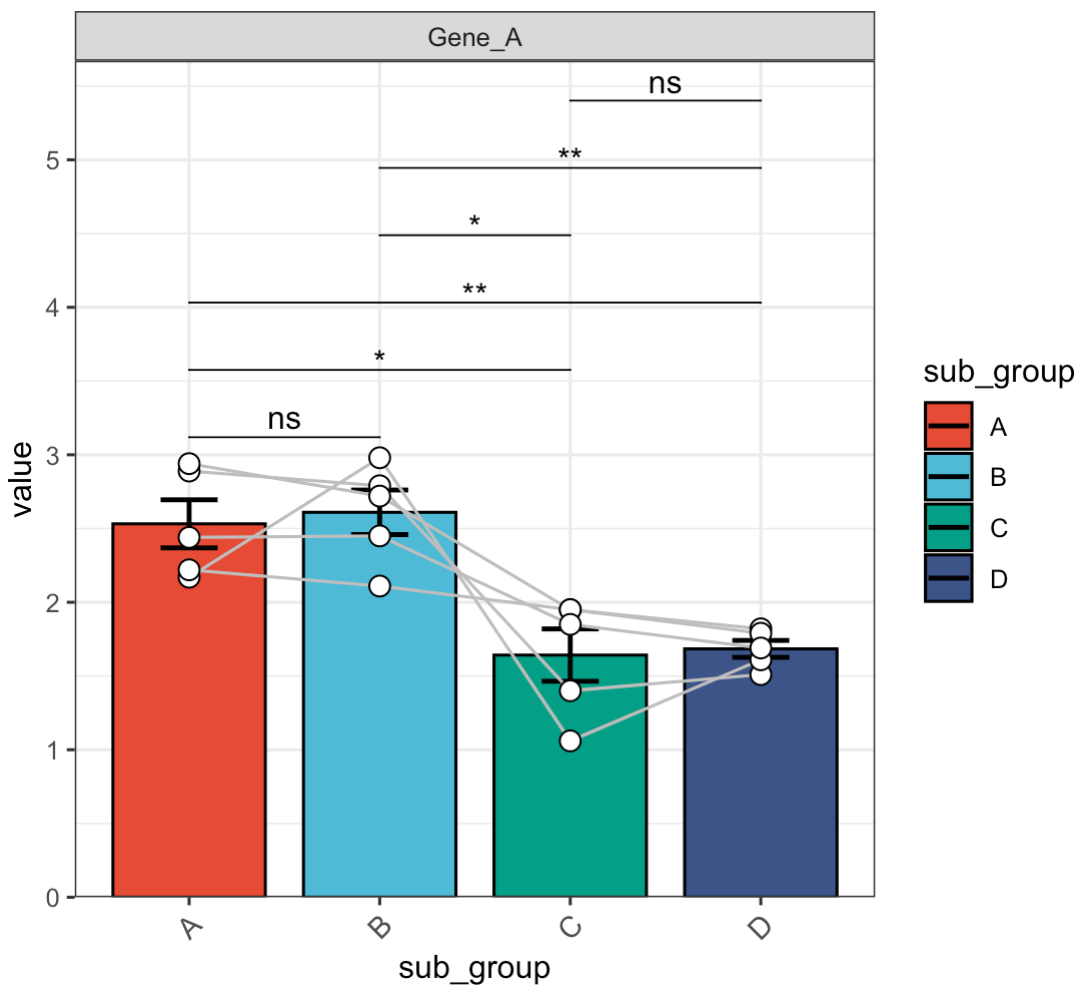
🏷️Example 5: Adjust significance labels.
MAE |>
  EMP_assay_extract() |>
  EMP_filter(filterFeature = 'Gene_A') |>
  EMP_barplot(estimate_group = 'sub_group',
              method = 't.test',
              paired_group = 'patient',
              label = 'p.signif')
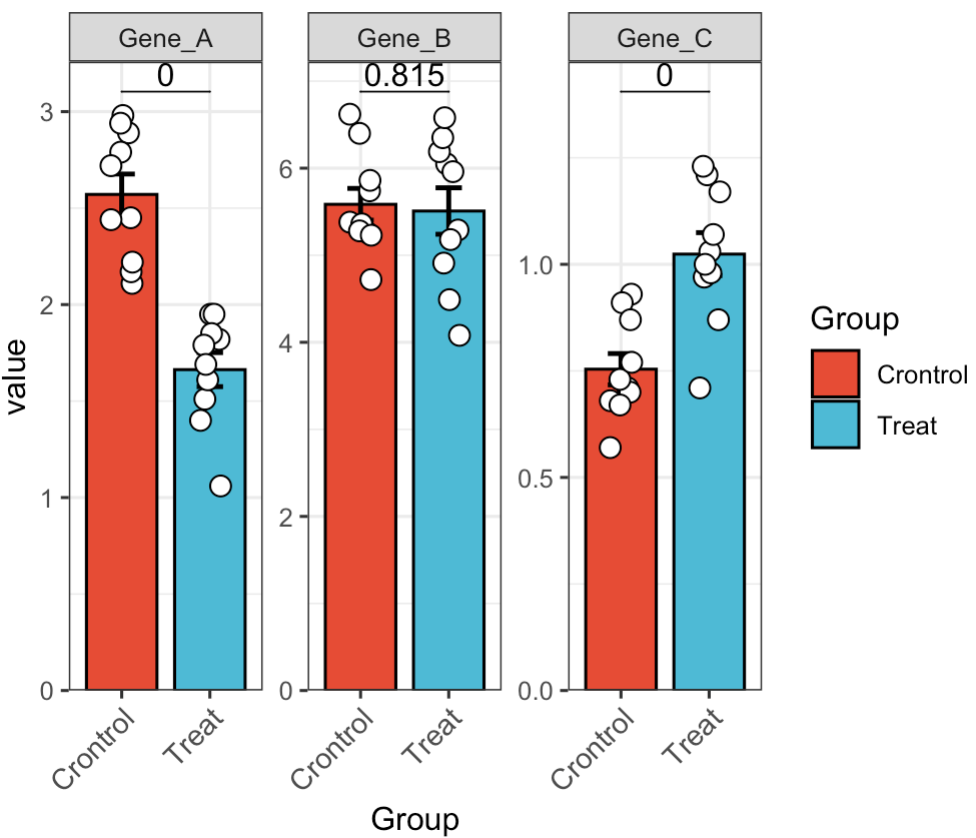
🏷️Example 6: Differential analysis for multiple genes.
MAE |>
  EMP_assay_extract() |>
  EMP_barplot(estimate_group = 'Group',method = 't.test')
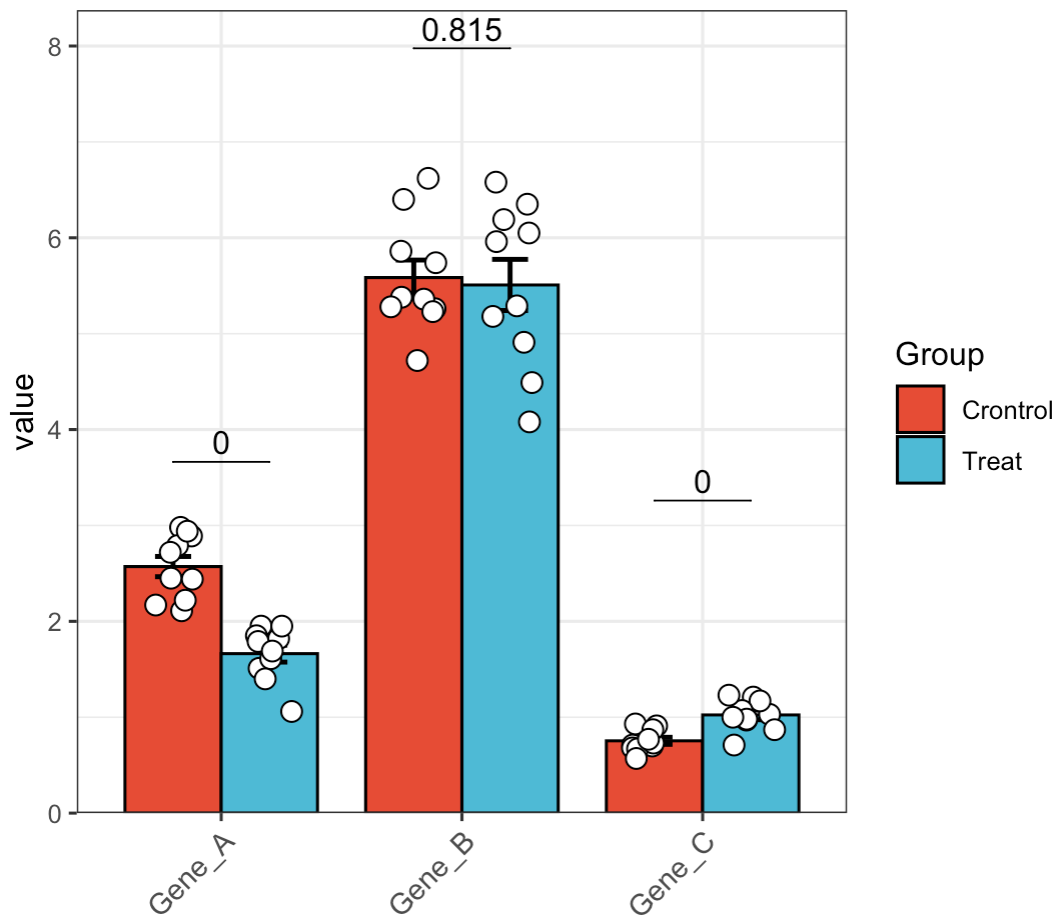
🏷️Example 7: Display multiple genes in a combined plot.
MAE |>
  EMP_assay_extract() |>
  EMP_barplot(estimate_group = 'Group',method = 't.test',facet = FALSE)
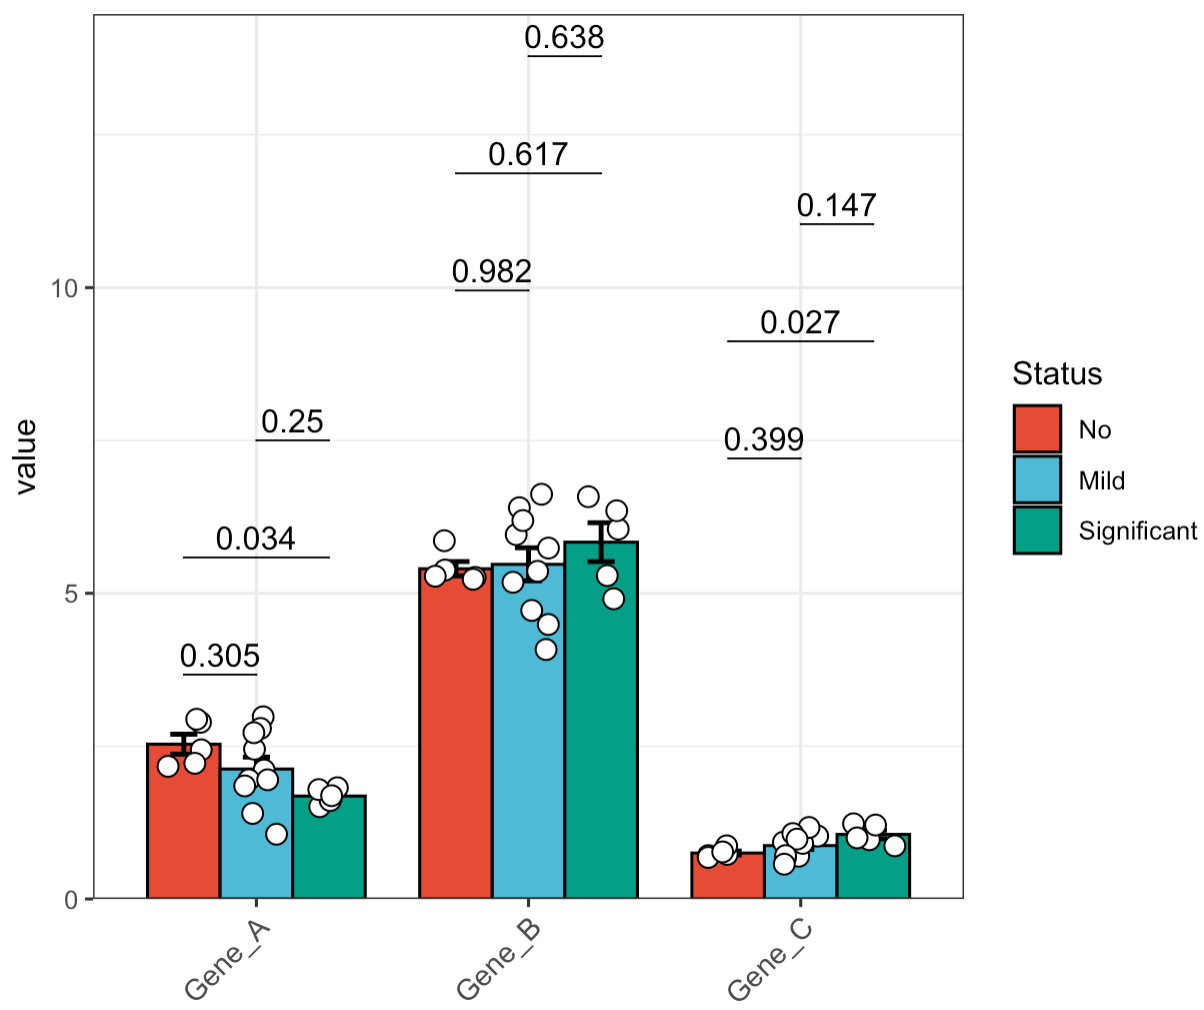
🏷️Example 8: Subgroup analysis. For multi-group analysis, if the data is normally distributed, we recommend using tukey.hsd for pairwise comparisons. If the data is not normally distributed, dunn.test can be used as an alternative for pairwise comparisons.
MAE |>
  EMP_assay_extract() |>
  EMP_barplot(estimate_group = 'Group',compare_group = 'Status',
              method = 'tukey.hsd',facet = FALSE)
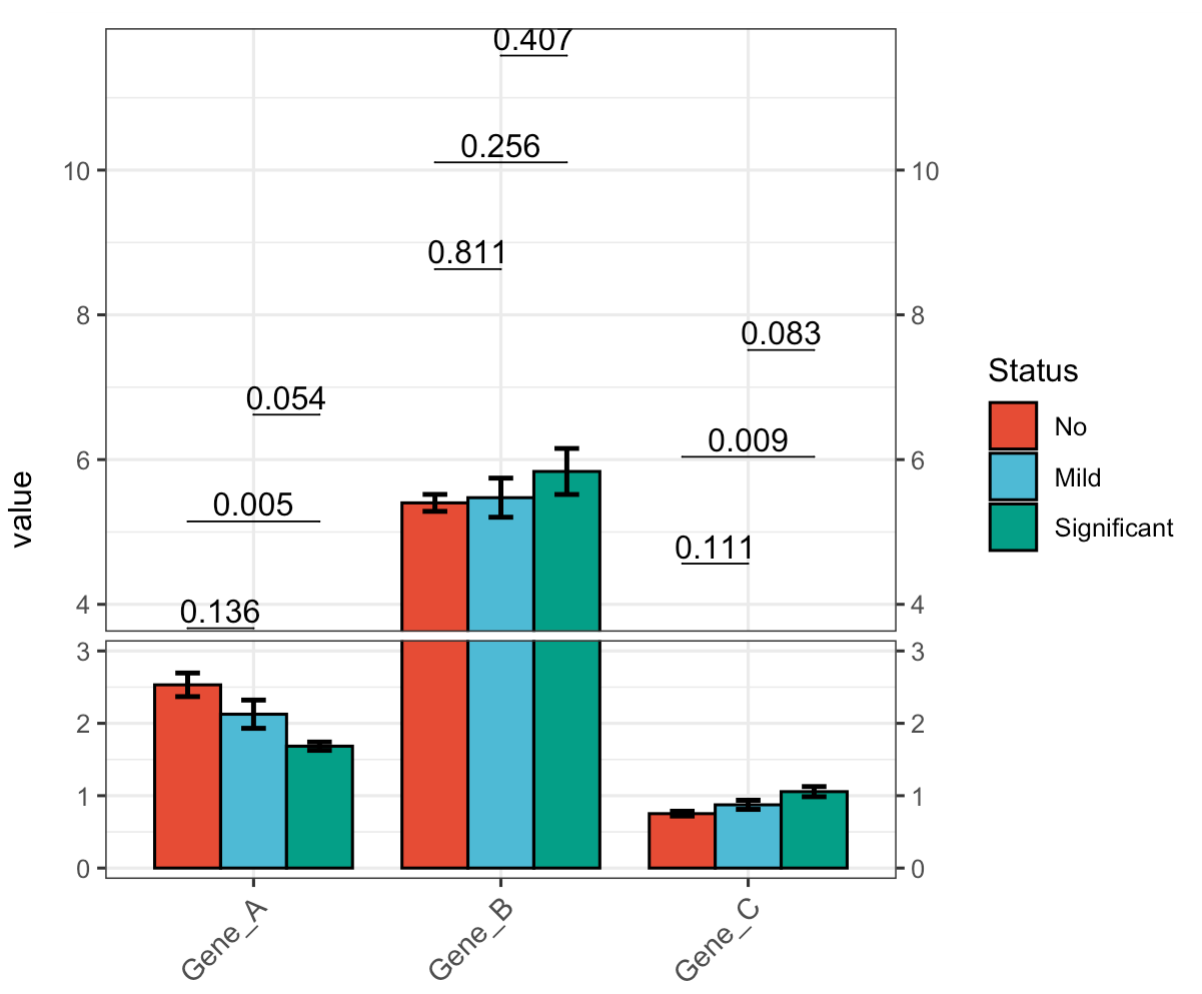
🏷️Example 9: Broken Y-axis.
MAE |>
  EMP_assay_extract() |>
  EMP_barplot(estimate_group = 'Group',
              compare_group = 'Status',
              hide_point = TRUE,
              step.increase = 0.05,
              method = 't.test',facet = FALSE,
              y_break = c(3,4))
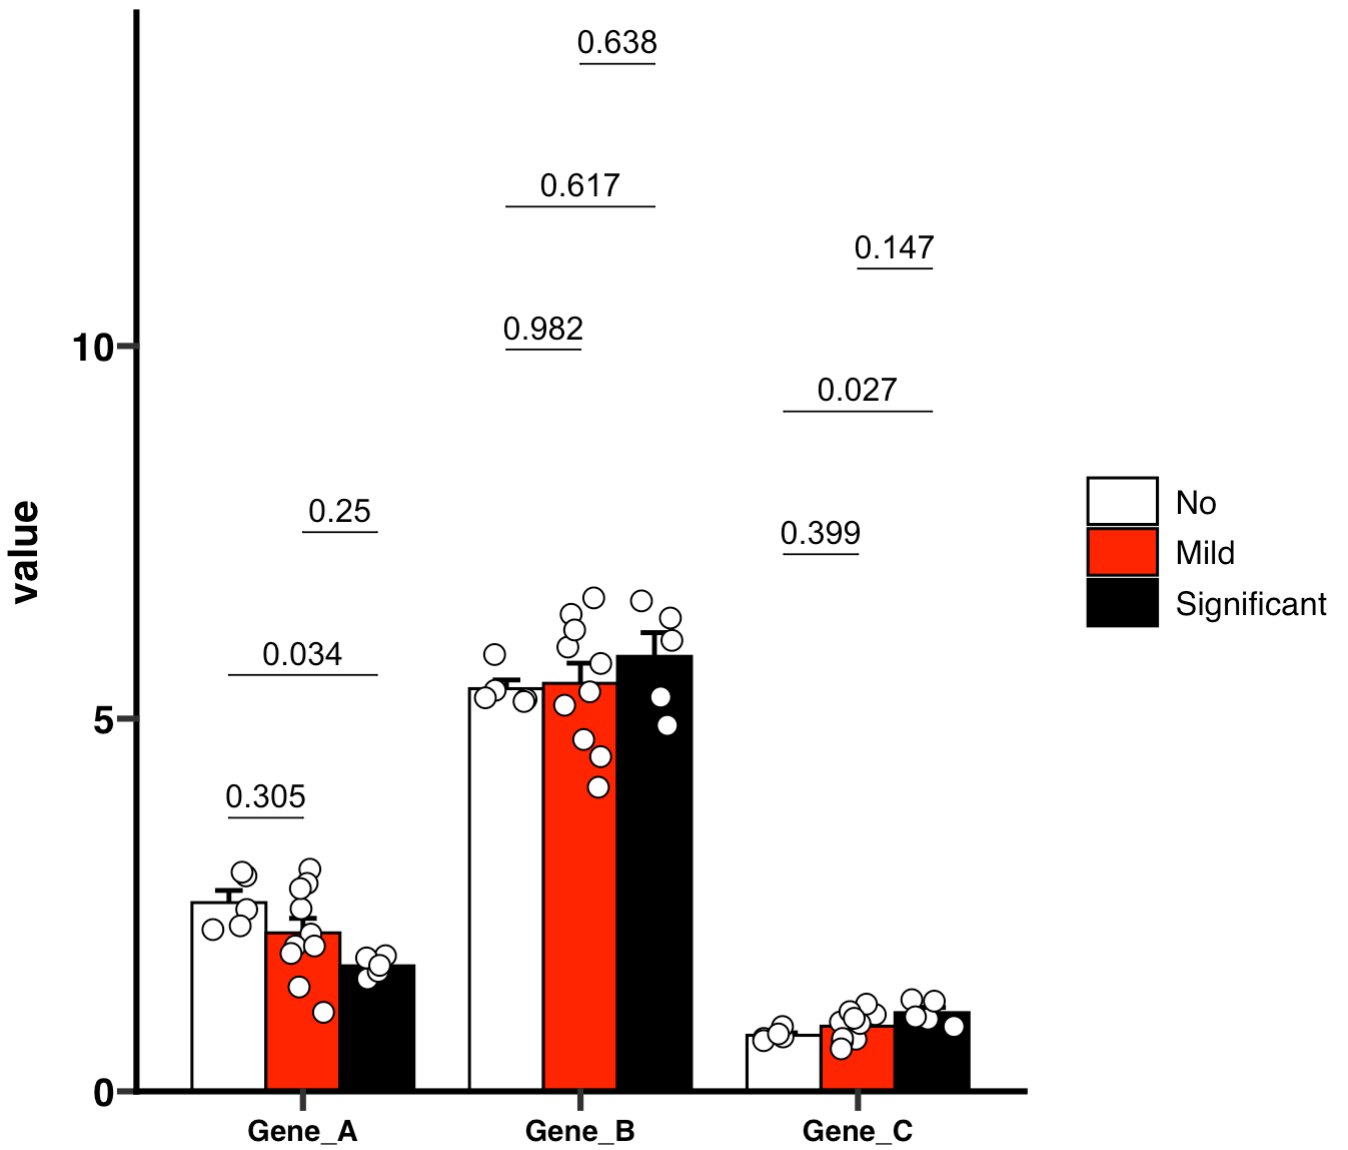
🏷️Example 10: Create a bar plot in GraphPad Prism style.
if (!requireNamespace("ggprism", quietly=TRUE)) install.packages("ggprism")
library(ggprism)
MAE |>
  EMP_assay_extract() |>
  EMP_barplot(estimate_group = 'Group',compare_group='Status',
              palette = c('white','red','black'),error_bar = 'upper',
              method = 'tukey.hsd',facet = FALSE,
              mytheme ='theme_prism()')
🏷️Example 11: Create a hollow bar plot in GraphPad Prism style.
MAE |>
  EMP_assay_extract() |>
  EMP_barplot(estimate_group = 'Group',
              bar_alpha = 0,bar_color = 'group',
              palette = c('red','green'),error_bar = 'upper',
              method = 'tukey.hsd',dot_color = 'group',
              mytheme ='theme_prism()')
